Gel Documentation Systems Market
Gel Documentation Systems Market Analysis By Product By Light Source By Detection Technique By Application, End-Use & Region - Global Market Insights 2025 to 2035
Analysis of Gel Documentation Systems Market Covering 30+ Countries Including Analysis of US, Canada, UK, Germany, France, Nordics, GCC countries, Japan, Korea, and many more
Gel Documentation Systems Market Outlook (2025 to 2035)
The gel documentation systems industry is valued at USD 297.2 million in 2025. As per Fact.MR’s analysis, the gel documentation systems industry will grow at a CAGR of 3.5% and reach USD 417.7 million by 2035.
In 2024, the gel documentation systems sector witnessed moderate but consistent growth spurred by increased demand from pharmaceutical laboratories, diagnostics centres, and academic research institutions. The growth in PCR-based applications, especially infectious disease detection and gene expression studies, was instrumental in fueling adoption. Integration of technology, such as higher imaging resolution, automated workflows, and advanced software analytics, kept redefining user expectations, facilitating sustained investment from both private and public sectors.
Moving forward to 2025, the industry can expect to gain significant momentum. Ongoing improvements in electrophoresis imaging equipment, along with increased emphasis on customized medicine and genomics, are expected to drive system upgrades and new installations. Increasing demand for accuracy and speed in the analysis of gels, particularly among developing economies making investments in healthcare infrastructure, will reinforce the industry's positive trend further.
| Metric | Value |
|---|---|
| Industry Value (2025E) | USD 297.2 million |
| Industry Value (2035F) | USD 417.7 million |
| CAGR (2025 to 2035) | 3.5% |
Don't Need a Global Report?
save 40%! on Country & Region specific reports
Market Analysis
The industry for gel documentation systems is progressing steadily, fostered by increasing spending on genomic and proteomic analysis in academic, clinical, and pharmaceutical institutions. The most influential driver of expansion is the expanding application of PCR and electrophoresis-based technologies for the detection of early-stage disease and molecular diagnosis. Leaders providing sophisticated, user-friendly image platforms will see maximum benefit, whereas old-style manual systems risk being made redundant.
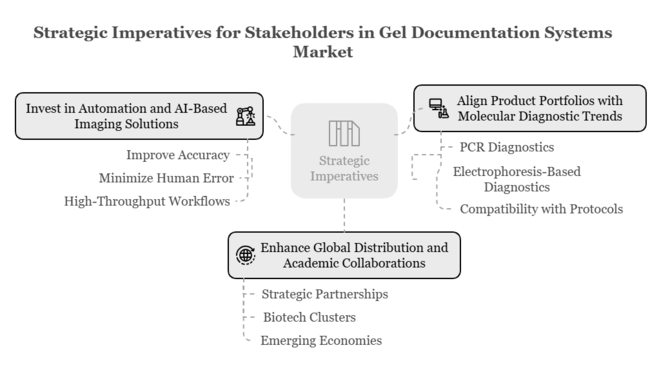
Top 3 Strategic Imperatives for Stakeholders
Invest in Automation and AI-Based Imaging Solutions
R&D and product development around automated gel documentation systems with built-in AI-based image analysis should be a priority for executives to improve accuracy, minimize human error, and address the increasing demand for high-throughput workflows.
Align Product Portfolios with Molecular Diagnostic Trends
Offerings need to be adapted to accommodate the increase in PCR and electrophoresis-based diagnostics, being compatible with existing clinical and research protocols to stay in sync with changing end-user requirements.
Enhance Global Distribution and Academic Collaborations
Growing strategic partnerships with academic institutions, biotech clusters, and diagnostic labs, particularly in emerging economies, will enhance sector growth and drive long-term growth through localized innovation and demand creation.
Top 3 Risks Stakeholders Should Monitor
| Risk | Probability - Impact |
|---|---|
| Gradual uptake of new systems - Technology notwithstanding, the initial high expense of contemporary gel documentation systems might discourage small laboratories and institutions in developing countries from upgrading. | Medium - High |
| Disruptions in supply chains - The persistent global issues, such as semiconductor shortages and logistics limitations, can slow the acquisition of imaging components and interfere with the timely production of systems. | High - Medium |
| Data compliance and cybersecurity - As systems are more digitally interconnected, non-compliance with strict data privacy regulations or safeguarding against cyberattacks might result in legal action and damage to one's reputation. | Medium - Medium |
1-Year Executive Watch-List
| Priority | Immediate Action |
|---|---|
| Accelerate AI-Driven System Development | Conduct a detailed feasibility and ROI study for implementing AI and machine learning algorithms into future-generation gel documentation systems to enhance image precision and minimize analysis time. |
| Deepen End-User Alignment | Initiate a formal OEM and end-user feedback program to research laboratories and diagnostic centers to improve system usability, workflow compatibility, and software integration. |
| Expand Emerging Sector Penetration | Implement a performance-based incentive pilot program for Asia-Pacific and Latin American regional distributors and channel partners to increase adoption in high-growth, underpenetrated sectors. |
More Insights, Lesser Cost (-50% off)
Insights on import/export production,
pricing analysis, and more – Only @ Fact.MR
For the Boardroom
To stay ahead, companies must shift from incremental innovation to disruptive digital integration in gel documentation systems. Future growth is in integrating AI-driven analytics, expanding connectivity with lab management systems, and tailoring solutions for high-growth applications such as molecular diagnostics and infectious disease detection.
This intelligence heralds a transition from hardware-led strategies to software-driven ecosystems. Firms that invest actively in building digital capabilities, form academic and clinical collaborations, and replicate region-specific go-to-sector models will achieve long-term dominance in a precision-led, automation-first diagnostics environment.
Segment-Wise Analysis
By Product Type
The instruments segment is expected to be the most profitable up to 2035 due to the ongoing development of imaging technology, the rising use of high-resolution and AI-based systems, and the higher demand from molecular biology laboratories and clinical diagnostics. Since core hardware continues to be critical for gel analysis protocols, institutions prefer to spend capital on next-generation imaging platforms rather than stand-alone software or accessories.
In addition, the fast development of gel documentation devices with functionalities such as multiplexing, automation, and increased sensitivity renders them essential in high-throughput diagnostics and research. The instruments segment is expected to expand at a CAGR of about 3.9% from 2025 to 2035.
By Light Source
The Light Emitting Diodes (LEDs) section is expected to be the most profitable between 2025 and 2035 due to its energy efficiency, longer working life, low heat emission, and the availability of a broad range of dyes and stains. LEDs are less likely to cause safety hazards compared to UV and lasers and minimize sample degradation, making them the choice for both clinical laboratories and academic research.
With sustainability and efficiency of operation becoming major buying considerations, LED-based systems are gaining robust traction, especially in mature sectors emphasizing precision and long-term cost-saving. The LED segment will grow at a CAGR of about 4.2% between 2025 and 2035.
By Detection Technique
The chemiluminescence segment is poised to dominate lucrativeness between 2025 and 2035 because of its high sensitivity, capacity to detect low-abundance proteins, and broad applicability in clinical diagnostics and cutting-edge molecular biology research. The detection method allows for high signal-to-noise ratios and is gaining popularity in Western blotting, immunodetection, and enzyme assays.
As laboratories seek higher accuracy and reproducibility of results, chemiluminescent systems are being adopted at a fast pace, especially in pharmaceutical R&D and academia. The chemiluminescence segment will expand by a CAGR of almost 4.4% between the years 2025 and 2035.
By Application
The nucleic acid quantitation segment is expected to be the most profitable until 2035 as a result of the increasing worldwide interest in genomics research, individualized medicine, and early disease diagnosis. Procedures like PCR, qPCR, and gene expression analysis are highly reliant on accurate nucleic acid quantitation, so gel documentation systems become key tools for quality control and verification. Increasing investments in genetic testing, infectious diseases surveillance, and cancer diagnostics further boost demand in this segment.
The nucleic acid quantification segment will grow at a CAGR of around 4.1% during the period 2025 to 2035, solidifying its supremacy.
By End-Use
The pharma & biotech companies’ segment will lead end-use applications during 2025 to 2035, driven by its key position in drug discovery, clinical research, and biomarker validation. With more funding directed towards biologics, personalized therapeutics, and large-scale proteomic and genomic research, gel documentation systems have become a necessity for reproducibility, data integrity, and quick analysis in regulated settings. Additionally, increasing demand for high-throughput workflows and automating imaging is further accelerating uptake in this space.
The pharma & biotech companies segment is anticipated to grow at a CAGR of almost 4.5% between 2025 and 2035 with the help of their faster R&D pipelines.
Know thy Competitors
Competitive landscape highlights only certain players
Complete list available upon request
Country-Wise Analysis
United States
Strong NIH and life sciences private equity funding keep demand high for advanced gel documentation systems in the USA The transition to multi-omics research and next-generation proteomics tools has driven strong momentum for systems with fluorescence and chemiluminescence detection. Top research institutions and biotech companies are focusing on high-throughput, automated imaging solutions with AI integration for fast analysis.
Integration with LIMS (Laboratory Information Management Systems) and data encryption capabilities are key decision drivers. With the increase in tele-lab and hybrid academic research settings, cloud-connected imaging devices are experiencing a surge. Fact.MR forecasts that the CAGR of the United States will be 3.9% from 2025 to 2035.
India
India is experiencing an upsurge in investments in molecular biology because of increased infectious disease surveillance and oncology diagnostics. Government initiatives such as DBT's Biotech Research and Innovation Council (BRIC) and the National Biopharma Mission have encouraged funding support for the modernization of laboratory infrastructure. Entry-level and mid-level gel documentation systems are used in academic institutions and mid-sized biopharmaceutical companies.
Startups are targeting mobile-friendly platforms for distant diagnostics, corresponding to the development of telemedicine. With mounting clinical trial activity and genomic mapping programs, image-based quantification will increase across CROs and research parks. Fact.MR opines that India's CAGR will be 4.1% from 2025 to 2035.
China
China's synbio and superdiagnostics ambitions are directly driving industry growth in gel documentation. The national government's thrust to upgrade the life science lab infrastructure under the "Made in China 2025" scheme is driving further use of multi-modal imaging platforms. State universities and regional biotech park-based institutions are financing high-resolution and compact systems used for proteomics and gene expression research. In sync with this, increased COVID-19 surveillance needs have mainstreamed the usage of nucleic acid quantification systems even for metro non-core labs.
Further, companies exporting are gearing their product ranges towards adhering to global standards in data security. Fact.MR is of the opinion that the CAGR of China will be 4.0% from 2025 to 2035.
United Kingdom
The UK's strategic investment in the "Life Sciences Vision" and genomics medicine service has reinforced infrastructure for molecular diagnostics, which is directly benefiting the gel documentation systems industry. High-throughput workflows are growing in university hospitals, especially in oncology and microbiology laboratories. The requirement for secure cloud-based data storage has increased demand for GDPR-compliant imaging software. Precision imaging tools that enable dual-mode detection (fluorescence and UV) are gaining traction.
Lab workflow automation and the need for systems that are compatible with digital pathology are increasingly popular in diagnostic laboratories. Fact.MR opines that the CAGR of the United Kingdom will be 3.5% from 2025 to 2035.
Germany
Germany's leadership in pharmaceutical production and EU-funded biotech research provides a profitable terrain for gel documentation system sales. R&D units in big pharma firms are driving systems with quicker image capture and automated quantification, especially in protein assay workflows. German universities also prefer modular systems that support post-purchase add-ons. The pressure for greener labs is creating demand for energy-efficient, smaller image systems with lower UV exposure.
Moreover, government policies favoring AI implementation in healthcare are facilitating the integration of intelligent analytics in gel imaging. Fact.MR projects that the CAGR of Germany will be 3.7% from 2025 to 2035.
South Korea
As the Korean government makes biotech exports and life sciences R&D a top priority via the "K-Bio Strategy," gel documentation systems are experiencing strong adoption. Big pharma and university research laboratories are making investments in the next-generation instruments for RNA/DNA analysis in vaccine work, research on rare diseases, and biomarker studies. Higher fluorescence sensitivity and real-time syncing to the cloud are among the features that Korean laboratories are looking for.
Local producers are coming up with competitively priced digital systems, which are causing import substitution in research institutions. South Korea's robust digital infrastructure drives the adoption of cloud-based platforms for remote experiment monitoring. Fact.MR forecasts that the CAGR of South Korea will be 3.9% from 2025 to 2035.
Japan
Japan's gel documentation industry is developing sophisticated features such as AI-based detection, high-definition optics, and spectral imaging, which are in increasing demand. The requirement for accurate protein quantification in neurodegenerative and metabolic disease studies is driving the demand for chemiluminescence systems. Adherence to PMDA's guidelines for digital documentation is also driving purchasing decisions.
Intelligent lab projects in the context of Society 5.0 are driving national research networks to incorporate gel documentation systems. Also, collaborations with USA and European biotechnology companies are speeding up demand for globally compliant imaging solutions. Fact.MR is of the opinion that the CAGR of Japan will be 3.6% from 2025 to 2035.
France
France's strategic focus on genomics and translational medicine, promoted by Inserm and the National Cancer Institute, is stimulating the application of gel imaging within laboratory workflows. Hospital-based research units and public-private partnerships are investing in cloud-compatible systems suitable for multiplex imaging and band analysis automation. The drive toward cloud-native platforms in diagnostics concurs with national digital health policy. Scientists increasingly favor systems that simplify workflow integration with PCR and electrophoresis equipment.
Innovation grants under the "Plan France 2030" also support startups in creating compact, portable systems. Fact.MR opines that the CAGR of France will be 3.4% from 2025 to 2035.
Italy
Italy is expanding its life sciences infrastructure through public-private cluster initiatives in Lombardy and Emilia-Romagna, with rising adoption of gel documentation systems. Research-oriented hospitals are investing in personalized diagnostic tools in oncology and infectious disease monitoring. Plug-and-play software and dual-mode imaging mid-range systems are popular because of limited budgets in the laboratory.
Academic researchers are leading the demand for systems that provide long-term archiving, particularly in genetic and microbiological research. Local collaborations with EU-funded initiatives are encouraging R&D in automated quantification systems of nucleic acids. Fact.MR forecasts that the CAGR of Italy will be 3.3% from 2025 to 2035.
Australia-New Zealand
Australia and New Zealand are together increasing their genomics and biomedical research presence through initiatives such as Genomics Australia and the Health Research Council of NZ. There is a growing demand for gel documentation systems within academic consortia and diagnostic research centers specializing in cancer and orphan diseases. Chemiluminescence imaging is increasingly being used for its high sensitivity in Western blotting and protein assay protocols.
Studies related to personalized medicine and native health research are driving geographic adoption more broadly. Fact.MR analysis found that the CAGR of both regions is 3.5% from 2025 to 2035.
Fact.MR Survey Results: Gel Documentation Systems Industry Dynamics Based on Stakeholder Perspectives
(Surveyed Q4 2024, n=450 stakeholder participants evenly distributed across manufacturers, distributors, researchers, and lab technicians in the USA, Western Europe, Japan, and South Korea)
Key Priorities of Stakeholders
- Imaging Accuracy and Sensitivity: 84% of worldwide stakeholders considered imaging resolution, specifically low-noise/high-resolution CCD/CMOS sensors, a "critical" performance aspect.
- Compatibility and Workflow Integration: 71% emphasized having easy compatibility with electrophoresis units and laboratory data management software (e.g., LIMS).
Regional Variance:
- USA: 63% wanted automation-ready systems (e.g., auto-exposure and gel size detection), versus 37% in South Korea.
- Western Europe: 76% prioritized eco-design (low energy use, RoHS compliance) as a major issue, compared with 44% in the USA.
- Japan/South Korea: 58% preferred compact benchtop sizes for small space-labs, compared with 29% in the USA.
Accepting Advanced Technologies
Adoption Levels:
- USA: 66% utilized AI-driven documentation tools with auto-segmentation for band quantification.
- Western Europe: 54% accepted cloud-connectivity for remote operation and data storage, with Germany being 61%.
- Japan: 31% employed fluorescence multiplexing, citing complexity as a limitation to wider adoption.
- South Korea: 42% invested in hybrid UV/LED systems to reduce gel degradation and enhance dye flexibility.
ROI Perception:
- 70% of USA stakeholders and 64% in Western Europe concurred that sophisticated imaging systems greatly diminished repeat gel runs and improved reproducibility. Only 28% in Japan perceived a similar value from automation.
Material and Hardware Preferences
Global Consensus
- 67% opted for metal-enclosed imaging platforms (aluminum or powder-coated steel) due to durability and protection from lab contamination.
Regional Variance:
- Western Europe: 59% opted for modular systems with exchangeable filters and trays.
- Japan/South Korea: 46% chose systems with noise-reducing insulation for quiet lab conditions.
- USA: 72% opted for touchscreen interfaces with glove-compatible displays, particularly in shared academic settings.
Price Sensitivity
Shared Issues:
- 85% listed increasing prices of optical sensors (up 22%) and licenses for imaging software (up 17%) as key buying issues.
Regional Variations:
- USA/Western Europe: 61% prepared to pay 10-15% extra for systems with automated calibration and cloud storage.
- Japan/South Korea: 69% insisted on budget models (
- South Korea: 41% favored lease-to-own and grant-funded by university options, versus only 19% in the USA.
Pain Points in the Value Chain
Manufacturers:
- USA: 57% mentioned late delivery of semiconductor components (CCD chips).
- Western Europe: 52% experienced difficulties in meeting changing CE/EMC directives for lab equipment.
- Japan: 61% mentioned challenges in miniaturizing systems without degrading optical resolution.
Distributors:
- USA: 68% mentioned repeated firmware-related returns and upgrades.
- Western Europe: 50% experienced competition from low-cost but uncalibrated Asian suppliers.
- Japan/South Korea: 63% reported shipping delays and customs bottlenecks for high-precision components.
End-Users (Lab Technicians/Researchers):
- USA: 46% reported inconsistent software updates.
- Western Europe: 41% complained about high learning curves for new documentation interfaces.
- Japan: 56% did not have on-site training or multilingual technical documentation.
Priorities for Future Investment
Alignment:
- 72% of worldwide manufacturers intended to invest in AI-driven auto-detection and quantification algorithms.
Divergence:
- USA: 64% wanted to improve touchscreen UIs and implement wireless data sharing.
- Western Europe: 58% were interested in sustainable packaging and end-of-life recycling schemes.
- Japan/South Korea: 47% were looking at ultra-compact units for mobile or satellite labs.
Regulatory Influence
- USA: 66% believed FDA's Good Laboratory Practice (GLP) compliance rules had an impact on upgrades to newer, traceable systems.
- Western Europe: 83% reported that the EU's Digital Europe Programme spurred demand for lab digitization and documentation improvements.
- Japan/South Korea: 35% only reported regulation affecting purchasing decisions; most labs conformed to institutional, rather than national, standards.
Conclusion: Variance vs. Consensus
High Consensus:
- Stakeholders widely agreed on the significance of image clarity, integration into lab workflow, and coping with escalating component costs.
Key Variances:
- USA: Automation and touch-screen efficiency prioritization vs. Japan/South Korea: Lean, space-efficient, low-cost inclinations.
- Western Europe: Strong emphasis on sustainability and digital compliance.
Strategic Insight:
- Customization is the key. While North America focuses on performance and cloud utility, Asia requires low-cost, compact units, and Europe likes eco-compliant, modular systems. A multi-segment strategy will facilitate penetration across geographies.
Government Regulations
| Country | Regulatory Impact and Mandatory Certifications |
|---|---|
| United States | Gel documentation systems are FDA-regulated. Devices can be required to get a premarket notification (510(k)) or clearance based on the classification. Good Laboratory Practices (GLP) compliance is required in research environments. [Source - FDA] |
| India | The Indian Council of Medical Research (ICMR) offers technical specifications for gel documentation systems, which are commonly adopted in public procurement. Although there are no specific certifications required, compliance with ICMR norms and BIS standards enhances industry acceptability. [Source - ICMR] |
| China |
Products need to secure the China Compulsory Certification (CCC). Companies need to undergo product testing and an audit to meet Chinese safety and performance standards. [Source - China Certification Centre for Medical Devices] |
| United Kingdom |
Gel documentation systems will need to have a UKCA (UK Conformity Assessed) mark after Brexit, as per the UK Medical Devices Regulations 2002. This is in place of the CE marking in Great Britain. [Source - UK Government] |
| Germany |
Germany adheres to the EU MDR paradigm. CE marking is required on all gel documentation systems. Optional GS (tested safety) certification is also sought for additional assurance of protection according to German regulations. [Source - TÜV SÜD] |
| South Korea |
They need to comply with Korea Good Manufacturing Practice (KGMP) standards. MFDS (Ministry of Food and Drug Safety) oversees the certification process, including QMS audits and product testing. [Source - Qserve Group] |
| Japan |
Gel documentation systems are classified and inspected by the PMDA under the PMD Act. Certification is to be acquired through a Registered Certification Body (RCB), with adherence to QMS standards. [Source - PMDA Japan] |
| France |
Compliance with EU MDR and CE marking is obligatory. Also, ANSM regulations ensure compliance with safety, performance, and GMP procedures. Regulatory audits are regularly performed for high-risk devices. [Source - ANSM] |
| Italy |
Italy requires CE marking under EU MDR. National regulation comes through the Ministry of Health together with notified bodies such as SGS Italy, which undertake conformity assessment and audits. [Source - SGS Italy] |
| Australia-New Zealand |
Australia requires listing on ARTG by way of the Therapeutic Goods Administration (TGA), and other states necessitate registration on the WAND database for Medsafe. Both require proof of device safety, effectiveness, and QMS compliance. [Source - Greenlight Guru] |
Competitive Landscape
The industry for gel documentation systems is diversified, with numerous global and regional companies providing various product lines to suit different laboratory requirements.
Its major strategies include acquisitions and mergers for increasing technological strength, collaborations with academic and biotech institutions, and new product launches with a focus on automation, AI-powered image analysis, and cloud-based data management systems.
In February 2024, Bio-Rad Laboratories bought an advanced imaging solutions provider to expand its gel documentation product portfolio. This acquisition is anticipated to enhance its product portfolio and enhance imaging precision in molecular research workflows [Source-EIN Presswire].
In March 2024, Thermo Fisher Scientific signed a co-development agreement with a biotechnology company to manufacture AI-based gel documentation systems for enhanced lab productivity and data processing [Source-EIN Presswire].
In April 2024, Syngene introduced a new range of gel documentation systems with greater sensitivity and a user-friendly interface design for use in mid-sized biotech and academic research laboratories [Source-EIN Presswire].
Market Share Analysis
Bio-Rad Laboratories (≈25%)
Global leader in life science research, Bio-Rad provides high-performance gel doc systems such as the ChemiDoc™ MP Imaging System, which is renowned for exceptional sensitivity and multiplex fluorescence detection. Their systems are compatible with AI-based analysis software, serving genomics, proteomics, and QC laboratories.
Thermo Fisher Scientific (≈22%)
Thermo Fisher's iBright™ Imaging Systems are both flexible (Western blots, fluorescence, chemiluminescence) and cloud-based in terms of data management. Their emphasis on automation and IoT technology is a plus for high-throughput laboratories.
GE Healthcare (Cytiva) (≈18%)
Cytiva's Amersham™ ImageQuant™ instruments lead in precision and reproducibility for biopharma and academic research. Their instruments enable CRISPR validation and protein analysis. Collaborations with AI startups provide image analysis enhancements, fueling adoption in regulated environments.
Azure Biosystems (≈12%)
Renowned for affordable but state-of-the-art systems such as the Azure 600, Azure Biosystems concentrates on small- to midsize laboratories. There are multi-mode imaging (IR, UV) and easy-to-use software capabilities. Customer retention is supported through their direct selling strategy and immediate technical assistance.
Vilber Lourmat (≈10%)
An EU leader, Vilber's Fusion FX line features modularity for densitometry, fluorescence, and chemiluminescence. Their instruments are highly valued for low-light detection sensitivity and durability, being in great demand for clinical diagnostics.
LI-COR Biosciences (≈8%)
Experts in near-infrared (NIR) imaging, LI-COR's Odyssey® Systems minimize background noise for high-resolution Western blots. Its emphasis on sustainability (low-energy lasers) and multiplexing matches current lab needs.
Other Key Players
- Merck KGaA
- Scientific Digital Imaging Plc.
- Cleaver Scientific
- Syngene
- Bio-Techne
- Vilber Lourmat
- Analytik Jena
- DNR Bio-Imaging Systems
- UVP (Analytik Jena subsidiary)
- Gel Company
Segmentation
Segmentation by Product:
- Instruments
- Software
- Accessories
Segmentation by Light Source:
- Light Emitting Diodes
- UV
- Lasers
Segmentation by Detection Technique:
- UV Detectors
- Fluorescence
- Chemiluminescence
Segmentation by Application:
- Nucleic Acid Quantification
- Protein Quantification
- Others
Segmentation by End Use:
- Academic & Research Institutes
- Pharma & Biotech Companies
- Diagnostic Laboratories
- Others
Segmentation by Region:
- North America
- Latin America
- Europe
- East Asia
- South Asia
- Oceania
- Middle East and Africa (MEA)
Table of Content
- Executive Summary
- Market Overview
- Key Market Trends
- Market Background
- Market Context
- Global Market - Pricing Analysis
- Global Market Value Analysis 2020 to 2024 and Forecast, 2025 to 2035
- Global Market Analysis 2020 to 2024 and Forecast 2025 to 2035, By Product
- Instruments
- Software
- Accessories
- Global Market Analysis 2020 to 2024 and Forecast 2025 to 2035, By Light Source
- Light Emitting Diodes
- UV
- Lasers
- Global Market Analysis 2020 to 2024 and Forecast 2025 to 2035, By Detection Technique
- UV Detectors
- Fluorescence
- Chemiluminescence
- Global Market Analysis 2020 to 2024 and Forecast 2025 to 2035, By Application
- Nucleic Acid Quantification
- Protein Quantification
- Others
- Global Market Analysis 2020 to 2024 and Forecast 2025 to 2035, By End Use
- Academic & Research Institutes
- Pharma & Biotech Companies
- Diagnostic Laboratories
- Others
- Global Market Analysis 2020 to 2024 and Forecast 2025 to 2035, By Region
- North America
- Latin America
- Europe
- East Asia
- South Asia
- Oceania
- Middle East and Africa (MEA)
- North America Market Analysis 2020 to 2024 and Forecast 2025 to 2035
- Europe Market Analysis 2020 to 2024 and Forecast 2025 to 2035
- Middle East and Africa Market Analysis 2020 to 2024 and Forecast 2025 to 2035
- Rest of the World Market Analysis 2020 to 2024 and Forecast 2025 to 2035
- Key and Emerging Countries Market Analysis 2020 to 2024 and Forecast 2025 to 2035
- Market Structure Analysis
- Competition Analysis
- Bio-Rad Laboratories
- Thermo Fisher Scientific
- GE Healthcare (Cytiva)
- Azure Biosystems
- Vilber Lourmat
- LI-COR Biosciences
- Merck KGaA
- Scientific Digital Imaging Plc.
- Cleaver Scientific
- Syngene
- Bio-Techne
- Analytik Jena
- DNR Bio-Imaging Systems
- UVP (Analytik Jena subsidiary)
- Gel Company
- Assumptions and Acronyms Used
- Research Methodology
Don't Need a Global Report?
save 40%! on Country & Region specific reports
- FAQs -
What is spurring growth in the gel documentation systems industry?
The growing demand for molecular diagnostics and rising investments in life sciences research are key drivers of growth.
What regions are leading the most rapid adoption of gel documentation systems?
North America and Asia-Pacific are driving adoption thanks to strong R&D infrastructure and growing biotech industries.
How are firms distinguishing themselves in this sector?
Companies are highlighting automation, AI-driven imaging, and cloud integration to boost performance and user experience.
How is regulation contributing to the direction of this industry?
Compliance with stringent standards of data accuracy and quality is driving companies to invest in certified and high-accuracy systems.
Are there new trends transforming this industry?
Yes, hybrid detection systems and portable documentation units are on the rise, especially in resource-constrained labs.
Gel Documentation Systems Market