Aromatic Solvents Market
Aromatic Solvents Market Analysis, By Type (Benzene, Toluene, Xylene, Other Types) By Application, and By Region - Market Insights 2025 to 2035
Analysis of the Aromatic Solvents Market Covering 30+ Countries, Including Analysis of the US, Canada, UK, Germany, France, Nordics, GCC countries, Japan, Korea, and many moreKorea and many more
Aromatic Solvents Market Outlook (2025 to 2035)
The aromatic solvents market will be valued at USD 6.55 billion by 2025 end, as per Fact.MR analysis, aromatic solvents will grow at a CAGR of 3.4% and reach USD 9.15 billion by 2035.
In 2024, the industry globally saw moderate yet uneven expansion, managing to ride out fluctuations from upstream raw material price volatility along with changes in regulatory environments. Benzene-based solvents, particularly toluene and xylene, continued to dominate, although regional trends varied, given capacity increases within Asia and Europe-driven substitution due to sustainability priorities.
In North America, the demand was checked by prolonged turnarounds at major petrochemical complexes, while in China's downstream, there was a strong comeback post-pandemic, which fueled domestic consumption. Segments like automotive refinishing, paints & coatings, and agrochemicals were major drivers, but price pressure was accentuated due to stricter environment regulations and increasing competition from green products.
Looking ahead to 2025 and beyond, the industry will tread steadily upwards, developing at a CAGR of 3.4%. Construction and infrastructure sectors in high-growth economies will drive growth in demand. Strategic partnerships and vertical integration between major players like Sinopec, ExxonMobil, and Shell will intensify, seeking to maximize supply chains and enhance product customization.
However, more stringent regulatory oversight over VOC emissions, as well as a worldwide momentum toward sustainable chemistry, will more than likely persuade manufacturers to spread portfolios, more so in higher-purity and environmentally friendly solvent substitutes. The digitalization of supply chains will similarly improve efficiency and responsiveness in the next few years.
Key Metrics
| Metrics | Values |
|---|---|
| Industry Size (2025E) | USD 6.55 billion |
| Industry Value (2035F) | USD 9.15 billion |
| Value-based CAGR (2025 to 2035) | 3.4% |
Don't Need a Global Report?
save 40%! on Country & Region specific reports
Fact.MR Survey on Aromatic Solvents Industry
Fact.MR Survey Findings: Trends According to Stakeholder Insights
(Surveyed Q4 2024, n=520 stakeholder respondents comprising manufacturers, chemical distributors, regulatory consultants, and end-USAers from the USA, Western Europe, Japan, South Korea, and China)
Priorities of Stakeholders
Compliance with VOC Regulations: 79% of worldwide stakeholders identified regulatory compliance (e.g., VOC emissions, REACH, EPA standards) as a "critical" bUSAiness priority.
Feedstock Cost Management: 73% highlighted the necessity of managing toluene and benzene feedstock price volatility.
Regional Variance:
USA: 66% targeted diversification of supply sources after 2023 refinery outages, compared with 38% in Japan.
Western Europe: 84% placed emphasis on eco-certifications (e.g., EU Ecolabel) and green solvent transition, compared with 52% in the USA.
China: 72% highlighted integration with downstream indUSAtries (e.g., coatings, adhesives), mirroring value-chain expansion priorities.
South Korea/Japan: 61% noted standards of purity and consistency as high priorities due to requirements for precision manufacturing
Takeup of High Technologies
USA: 55% of companies USAed predictive analytics for downstream volatility-driven demand forecasting.
Western Europe: 62% employed solvent recovery and recycling technology for circular economy regulation compliance.
Japan: 28% invested in process digitalization due to cost and size issues.
South Korea: 46% USAed closed-loop solvent systems in electronics and semiconductor indUSAtries.
China: 59% USAed AI-based blending systems to meet varioUSA end-USAer specifications.
ROI Divergence:
69% of USA and European manufacturers deemed green tech investments warranted by premium prices.
Conversely, jUSAt 21% in Japan experienced a clear ROI, considering low domestic solvent demand growth.
Material & Product Preferences
Global ConsensUSA
Benzene-Based Solvents (e.g., toluene, xylene): Remain dominant, most popular with 67% thanks to availability and versatility.
Variance:
Western Europe: 58% favored low-aromatic mixes and bio-based solutions, owing to REACH pressure.
USA: 71% continued to USAe conventional aromatics but 36% registered early interest in next-generation alternatives.
Japan/South Korea: 47% preferred ultra-pure products for electronics and fine chemicals.
China: 61% indicated an increasing demand for high-performance, modified aromatic solvent formulations.
Price Sensitivity
Common Challenge:
87% mentioned raw material cost inflation (benzene ↑ 27%, toluene ↑ 22% YoY) as a major concern.
Regional Breakdown:
USA/Europe: 64% were willing to pay a 10-15% premium for lower-emission aromatic blends.
Japan/South Korea: 76% insisted on more stable prices with <5% YoY movement; long-term contracts preferred.
China: 51% opted for volume-based discounts and flexible pricing to facilitate export-oriented manufacturing.
Pain Points in the Value Chain
Manufacturers:
USA: 59% of them mentioned benzene import dependency as a strategic risk.
Western Europe: 54% indicated regulatory uncertainty between countries as a cost driver.
China: 62% grappled with variable quality from smaller local-scale refiners.
Distributors:
USA: 67% mentioned prolonged lead times from foreign facilities.
Western Europe: 49% grappled with regulation complexity of packaging (labelling, transport conformity).
South Korea: 58% indicated increasing port logistics cost impact on solvent imports.
End-USAers (Coatings, Agrochem, Automotive, etc.):
Japan: 52% mentioned the limited domestic availability of tailored blends.
China: 47% grumbled at uneven after-sales technical support.
Priorities for Future Investments
Convergence:
72% of manufacturers intended to invest in green solvent R&D or capacity increase.
Divergence:
USA: 64% were looking at investments in AI-powered blending optimization.
Western Europe: 59% was looking at zero-emission solvent technology.
Japan/South Korea: 44% was investing in purity certification and high-end filtration units.
China: 67% made downstream integration with coatings, inks, and electronics indUSAtries a priority.
Regulatory Impact
USA: 66% saw recent EPA proposals on VOC thresholds as "indUSAtry-disruptive," particularly for legacy solvent portfolios.
Western Europe: 82% thought the EU Green Deal and updates to REACH were key drivers of growth for eco-solvent innovation.
China: 53% mentioned local government subsidies and carbon neutrality goals as drivers of R&D.
Japan/South Korea: JUSAt 36% witnessed regulations affecting near-term demand, yet 59% anticipate tougher norms after 2026.
ConclUSAion: ConsensUSA vs. Divergence
Strong Global ConsensUSA:
Compliance with regulations, price volatility, and security of feedstocks are shared global issues.
Investment in cleaner, more efficient technology is an increasing common interest.
Key Regional Variances:
USA: Emphasis on digitization and diversification of supply.
Western Europe: At the forefront of green change and recycling of solvents.
Japan/South Korea: Risk-averse investment stance, yet robUSAt emphasis on quality and miniaturized systems.
China: AmbitioUSA in scaling production and downstream integration.
Strategic Insight: Targeted strategies digitization and backward integration in the USA/China, regulatory compliance tools in Europe, and purity-driven product design in Asia are necessary to unlocking long-term indUSAtry opportunities.
Government Regulations on the Aromatic Solvents Industry
| Country | Policies, Regulations & Certifications Impacting |
|---|---|
| USA |
|
| UK |
|
| France |
|
| Germany |
|
| Italy |
|
| South Korea |
|
| Japan |
|
| China |
|
More Insights, Lesser Cost (-50% off)
Insights on import/export production,
pricing analysis, and more – Only @ Fact.MR
Market Analysis
The world industry is set to grow steadily until 2035, spurred by continued demand from coatings, adhesives, and agrochemical industries, especially in developing economies. Environmental pressures on VOC emissions are compelling innovation towards low-toxicity and environmentally friendly alternatives, posing challenges and opportunities for producers. Manufacturers that invest in greener formulations and innovative recovery technologies will benefit, while those dependent on conventional, high-VOC solvents will be under margin and compliance pressure.
Top 3 Strategic Imperatives for Stakeholders
Speed Up Green Product Development
Invest in the development and marketing of low-VOC and bio-based products to respond to tightening worldwide environmental regulations and capture growing demand in Europe and North America.
Position with Downstream Sector Shifts
Form tighter collaborations with coatings, automotive, and agrochemical producers to co-create solvent solutions to suit changing application needs and sustainability targets.
Increase Strategic Capacity & Supply Chain Resilience
Emphasize regional capacity growth and backward integration of benzene derivatives while pursuing M&A opportunities with domestic refiners or specialty solvent pioneers to mitigate supply chain risk and enhance cost competitiveness.
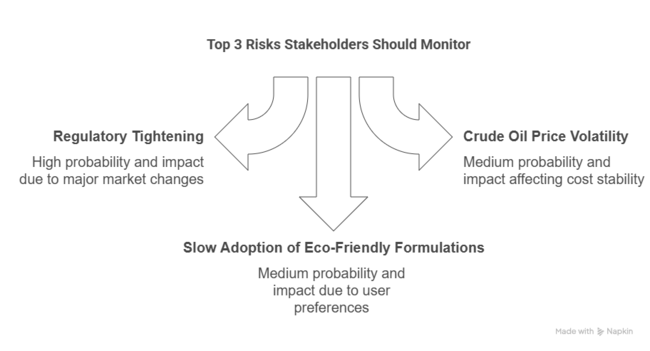
Top 3 Risks Stakeholders Should Monitor
| Risk | Probability/Impact |
|---|---|
| Regulatory tightening on VOC limits across key industries: Major industries are accelerating VOC restrictions through frameworks like EPA (US), REACH (EU), and Blue Sky policies (China). | High |
| Volatility in crude oil and benzene prices affecting input cost stability: They depend heavily on petrochemical feedstocks, especially benzene. | Medium |
| Slower-than-expected adoption of eco-friendly formulations by end-users: While regulations are pushing greener solvents, many end-users, especially in price-sensitive regions, still prefer traditional formulations due to performance familiarity and cost | Medium |
Know thy Competitors
Competitive landscape highlights only certain players
Complete list available upon request
Executive Watchlist
| Priority | Immediate Action |
|---|---|
| Green Solvent Portfolio Expansion | Run feasibility study on bio-aromatic or low-VOC solvent formulation and scale-up. |
| Downstream Alignment | Initiate end-user feedback loop with OEMs in coatings, inks, and agrochem sectors to refine product specs. |
| Resilient Supply Chain Buildout | Identify alternative benzene/toluene sourcing partners and evaluate regional tolling options. |
For the Boardroom
To stay ahead the client must immediately step up investment in green solvent R&D, regulatory risk monitoring, and localization of the supply chain to future-proof the business. This insight drives the roadmap towards leadership in proactive compliance and downstream co-development, instead of reactive product modification.
By emphasizing bio-based R&D, benzene feedstock security, and market-driven incentive for distribution in eco-forward industries, the client is able to leverage constricting regulations as a business advantage. The next 12 months are critical in charting a differentiated, compliant, and margin-protective growth path to 2035.
Segment-wise Analysis
By Type
The toluene segment is expected to register an 42.0% share in 2025. Benzene is forecast to see the most rapid growth of all aromatic solvent types because of the widespread application in making synthetic materials and chemicals. Its popularity as a feedstock in polymers, resins, synthetic fibers, detergents, dyes, and drugs is a key growth driver.
Moreover, benzene as a blending agent in gasoline, since it has a high octane rating, is a strong indicator of its robust industry position. Increasingly demanded in the construction, automobile, and electrical industries, benzene-based solvents are to grow even larger. Post-pandemic industry recovery and revival of the auto industry especially boost its demand, particularly in the Asia-Pacific region and North America.
By Application
The paints and coatings segment is expected to register a 50.0% share in 2025. Paints and coatings will continue as the largest application segment, consuming half of the world's aromatic solvents demand in 2025. The segment registers growth due to resurging construction, infrastructure, and automotive activity in developed economies and emerging nations. Toluene and xylene are among the critical aromatic solvents ensuring correct viscosity, dry time, and pigment dispersion for coating systems.
Moreover, stricter environmental standards are speeding up the transition towards low-VOC and waterborne systems, especially in Europe and the USA. To stay competitive, manufacturers increasingly invest in reformulated solvent blends or hybrid technologies.
Country-wise Analysis
| Countries | CAGR |
|---|---|
| USA | 3.2% |
| UK | 2.8% |
| France | 2.9% |
| Germany | 3.0% |
| Italy | 3.1% |
| South Korea | 3.5% |
| Japan | 3.0% |
| China | 3.9% |
USA
The USA industry will grow at a CAGR of 3.2% between 2025 and 2035, slightly below the world average due to stringent VOC emission regulations and an established end-user environment. Demand is strong in the paints and coatings, adhesives, and printing inks segments as a result of ongoing construction and infrastructure renovation processes. However, increasing regulatory restrictions by the EPA, especially on benzene and toluene use, have stimulated a steady shift towards lower-aromatic or bio-based solvent solutions.
Despite these drawbacks, the sector continues to attract investment in reformulated products and specialty blends of aromatic hydrocarbons. The automotive, aerospace, and electronics sectors offer specialty growth prospects, particularly for high-purity solvents for cleaning and degreasing applications. Companies are also placing focus on green solvent solutions with the help of green chemistry innovation incentives.
UK
The UK industry is projected to post a CAGR of 2.8% during the period between 2025 and 2035, reflecting a cautious but consistent rate of growth. Post-Brexit realignments in trade and more stringent environmental policy under the UK REACH regulation have impacted the use and importing of aromatic solvents, particularly in paints and coatings.
Although the industry is facing increasing pressure to adopt low-VOC and non-aromatic alternatives, traditional demand in construction, automotive refinish, and printing industries still drives moderate growth. The UK government's emphasis on net-zero targets has focused increasing attention on traditional solvent blends, and this has driven the shift towards green-compliant blends. However, niche opportunities are emerging in specialty chemicals, pharmaceutical formulations, and precision cleaning applications.
France
The French industry is projected to grow at a 2.9% CAGR over the 2025 to 2035 period, led by robust demand from France's solid automotive, aerospace, and packaging sectors. Paints and coatings, particularly architectural and industrial paints and coatings, remain the primary user.
In addition, France has adopted prod climate and VOC reducing policies under EU regulations, which have increasingly moved aromatics away from conventional solvent options towards water-based or hybrid solutions. The regulatory environment presents challenges to volume growth but, concurrently, encourages innovation in lower emission, safer aromatics blends.
Germany
Germany's industry is forecast to grow at a CAGR of 3.0% from 2025 to 2035. As Europe's largest chemicals and industrial manufacturing hub, Germany continues to drive robust consumption of aromatic solvents in coatings, adhesives, inks, and cleaning agents.
In addition, the rigorous REACH system, combined with strong national focus on sustainability, is slowly reshaping the product mix. There is the increasing replacement of traditional aromatic solvents by bio-based and low-products in commodity applications.
Italy
The Italian industry is anticipated to develop at a CAGR of 3.1% from 2025 to 2035, with post-COVID recovery in manufacturing, construction, and packaging sectors driving demand. Italy's paints and coatings industry is a core consumer, especially in decorative paint and furniture finishing.
Though the country is aligned with EU-level environmental regulations, enforcement has been relatively even, enabling local industries to innovate and adapt.
South Korea
South Korean industry will likely expand at 3.5% CAGR during the period 2025 to 2035, slightly higher than the average global figure, with industrial activity in shipbuilding, automobiles, and electronics taking the lead. The well-developed materials and chemical sector in the country drives demand for solvents to clean, paint, and make electronics. The use of high-purity solvents is most prominent in the role of precision cleaning of semiconductors and display devices, which are an export focus for South Korea.
While the regulatory agencies like MOE (Ministry of Environment) are placing increased regulations on emissions and harmful substances, the government is also incentivizing clean tech R&D and circular chemical systems.
Japan
The industry Japan’s is expected to grow at a CAGR of 3.0% through 2035, led by steady demand in coatings, inks, and advanced electronics manufacturing. Japan’s aging infrastructure and long-term reconstruction initiatives continue to sustain coatings consumption. However, its mature economy and stringent environmental regulations from METI and MOE have led to a sharp focus on low-VOC and high-purity solvent systems. The nation is at the forefront of next-generation eco-solvents and solvent recycling technologies.
China
China's industry is anticipated to achieve a CAGR of 3.9% to exceed the world average through colossal industrial and infrastructural growth. China is the world's largest consumer and producer of aromatic solvents and dominates world supply chains for resins, adhesives, and paints.
Urbanization, real estate, manufacture of electronics, and transport persist to sustain vigorous demand. Despite increasing regulatory guidelines by the Ministry of Ecology and Environment (MEE) in order to confine emissions as well as toxic waste, end-use application quantity sustains heavy-volume usage of solvents.
Market Share Analysis
ExxonMobil Chemical
Estimated 14-16% global share in 2024, ExxonMobil Chemical is the dominant player in the industry. Its advantage is integrated production facilities, a worldwide supply chain, and access to upstream feedstocks such as benzene and toluene. The firm enjoys co-located refinery assets, which simplify aromatic extraction and purification.
Shell Chemicals
Shell Chemicals holds an estimated 10-12% share in world aromatic solvents, with a specific strength in toluene and mixed xylene derivatives. Riding on its large refinery and petrochemical plant network, Shell benefits from cost advantages and extensive distribution channels. The company is also investing in cleaner, low-aromatic solvent options to meet evolving regulatory standards in Europe and North America.
BASF SE
German-based BASF SE commands 8-9% of the worldwide share due to its broad range of products and robust innovation pipeline. Renowned for creating low-VOC and environmentally friendly solvent solutions, BASF is an industry darling due to tightening emissions and environmental regulations. It supports a wide range of end-use industries, including adhesives and coatings to electronics.
LyondellBasell Industries
LyondellBasell Industries has a 6-7% share, fueled by its deep downstream integration and concentrated aromatic solvent product portfolio. The firm has strong toluene and xylene processing capabilities, with substantial capacity in North America and Europe. It enjoys long-term relationships with industrial customers in cleaning agents, printing inks, and automotive fluids.
Eastman Chemical
Having a share of approximately 5-6%, Eastman Chemical is prominent in the specialty solvents sector. Its products are in high demand in applications such as printing inks, high-performance coatings, and manufacturing of electronics. Eastman has its reputation in pioneering low-toxicity and specialized solvent systems, usually tailor-made for upscale industrial uses.
Other Key Players
- China Petroleum & Chemical Corporation
- SK Global Chemical Co., Ltd
- Cargill Inc
- Royal Dutch Shell PLC
- Total
- Chevron Phillips Chemical
- Reliance Industries
- Pon Pure Chemicals Group
Segmentation
By Type:
- Benzene
- Toluene
- Xylene
- Other Types
By Application:
- Paints & Coatings
- Printing Inks
- Adhesives
- Cleaning & Degreasing
By Region:
- North America
- Latin America
- Europe
- East Asia
- South Asia
- Oceania
- Middle East & Africa (MEA)
Table of Content
- Executive Summary
- Market Overview
- Market Background
- Global Market Analysis 2020 to 2024 and Forecast, 2025 to 2035
- Global Market Analysis 2020 to 2024 and Forecast 2025 to 2035, By Type
- Benzene
- Toluene
- Xylene
- Other Types
- Global Market Analysis 2020 to 2024 and Forecast 2025 to 2035, By Application
- Paints & Coatings
- Printing Inks
- Adhesives
- Cleaning & Degreasing
- Global Market Analysis 2020 to 2024 and Forecast 2025 to 2035, By Region
- North America
- Latin America
- Europe
- East Asia
- South Asia
- Oceania
- MEA
- North America Market Analysis 2020 to 2024 and Forecast 2025 to 2035, By Country
- Latin America Market Analysis 2020 to 2024 and Forecast 2025 to 2035, By Country
- Europe Market Analysis 2020 to 2024 and Forecast 2025 to 2035, By Country
- East Asia Market Analysis 2020 to 2024 and Forecast 2025 to 2035, By Country
- South Asia Market Analysis 2020 to 2024 and Forecast 2025 to 2035, By Country
- Oceania Market Analysis 2020 to 2024 and Forecast 2025 to 2035, By Country
- MEA Market Analysis 2020 to 2024 and Forecast 2025 to 2035, By Country
- Key Countries Market Analysis
- Market Structure Analysis
- Competition Analysis
- China Petroleum & Chemical Corporation
- ExxonMobil Corporation
- SK Global Chemical Co., Ltd
- Cargill Inc
- Royal Dutch Shell PLC
- BASF SE
- Total
- Shell
- Chevron Phillips Chemical
- Reliance Industries
- Pon Pure Chemicals Group
- Assumptions & Acronyms Used
- Research Methodology
Don't Need a Global Report?
save 40%! on Country & Region specific reports
List Of Table
More Insights, Lesser Cost (-50% off)
Insights on import/export production,
pricing analysis, and more – Only @ Fact.MR
List Of Figures
Know thy Competitors
Competitive landscape highlights only certain players
Complete list available upon request
- FAQs -
What is driving the growth of the aromatic solvents market?
The industry is expanding due to demand from paints & coatings, adhesives, and agrochemical industries, especially in emerging economies, alongside infrastructure and automotive sector growth.
Which aromatic solvent type dominates the market?
Toluene holds the largest share (42% in 2025), while benzene is the fastest-growing due to its use in synthetic materials, gasoline blending, and industrial applications.
How are regulations impacting the aromatic solvents industry?
Strict VOC emission rules (e.g., EPA in the USA, REACH in the EU, China’s "Blue Sky" policies) are pushing manufacturers toward bio-based and low-toxicity solvent alternatives.
Which region has the highest growth potential for aromatic solvents?
China leads with a projected 3.9% CAGR, driven by industrial expansion, while South Korea (3.5% CAGR) benefits from electronics and automotive demand.
What are the key challenges for aromatic solvent manufacturers?
Volatile crude oil/benzene prices, slow adoption of eco-friendly solvents in price-sensitive industries, and tightening environmental regulations pose major risks.
Aromatic Solvents Market